SASKATOON, SK – NOV 19, 2025: Croptimistic Technology Inc. is pleased to join Farm Credit Canada...
Showcase Your Sustainability with 4R Nutrient Stewardship
There is an increasing focus on 4R Nutrient Stewardship for the benefit of both the environment and economical sustainability. By improving practices around applying the 4Rs, the right source, at the right rate, right time, and right place, we can achieve significant agronomic, economic and environmental benefits. As the industry continues to adopt sustainable practices and new technologies, it’s increasingly important to showcase your farm’s proactive efforts.
Currently, there are established guidelines for nitrogen (N) and phosphorus (P), categorized into basic, intermediate, and advanced levels. Fertilizer Canada has published a detailed guidance document outlining the criteria for each nutrient rating:
👉 4R Guidance Tables – Fertilizer Canada (PDF)
How Do You Improve Your Farm’s 4Rs?
A SWAT MAP is a great place to start. The right source will be product-specific, and your SWAT agronomist can help you select it. The right time typically involves moving applications from fall to spring or in-season. Meanwhile, both the right rate and right place can be dramatically improved using SWAT MAPS technology.
Building a SWAT MAP
The first data layers collected are Electrical Conductivity (EC) and elevation. From these, topography layers are generated. The GIS team builds maps with different weightings of each layer, which are shared with the agronomist via the SWAT RECORDS app. The agronomist then ground-truths the field to determine which SWAT MAP best represents the actual conditions. From there, zones are soil sampled independently.
These soil test results reveal important trends in the field, including:
• Organic matter (mineralization potential)
• Residual nitrate and phosphate
• Cation Exchange Capacity (CEC)
• Salinity
CEC indicates soil texture, and elevated salinity levels may point to restricted root growth, which requires custom nutrient applications tailored to crop yield potential in those zones to ensure we are applying nutrients in a 4R fashion.
Why Ground-Truthing Matters
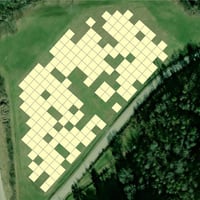
The field example below illustrates the importance of ground-truthing all data layers. It’s not enough to rely on EC alone—if only EC was considered here, hilltops and depressions might be grouped together because both show low EC. However, this doesn’t align with actual topography, water flow, or soil core data. This field ended up with a map weighted heavily on topography and accuracy was confirmed with the soil test.There are dramatic differences between N, P, K, S and salinity(EC) across the field, which warrants an intense variable create prescription to match crop needs and 4R stewardship.
{ImageLink}
Figure 1. Electrical conductivity map of a field where both hilltops and depressions appear similar but require very different management.
{ImageLink}
Table 1. Soil test results show significant variability in EC (salinity), N, P, K, and S—highlighting the importance of using topography-informed SWAT zones.
Figure 2. Variable rate prescription accounting for differences in N, P and S application.
Nitrogen Variability and Zone-Based Application
Nitrogen can be lost through volatilization, denitrification, and leaching. It is mobile in the soil and tends to migrate downslope during the season. This movement contributes to lower-lying areas staying greener or maturing more slowly.
Additionally, these areas often contain more moisture and higher levels of organic matter—boosting mineralization potential. Alternatively, some depressions may have high salinity that limits crop growth. In either case, it’s often appropriate to apply higher nitrogen rates in Zone 1 (hilltops) and lower rates in Zone 10 (depressions).
To achieve an advanced 4R rating for N application, you must go beyond field-level applications and factor in quantified field variability using digitized prescriptions. The following example demonstrates large variability in soils across a field with significant topography. Salinity, residual phosphate and nitrogen increase from zone 5 to 10 and yield analysis is done to confirm that yields consistently decline through these areas. This warrants a dramatic change in N applied – in this case from 32 to 68lbs actual N.
{ImageLink}
Figure 3. Water flow paths overlaid on a SWAT MAP, with yield trends across three crop years by zone.
{ImageLink}
Figure 4. A prescription for the field above showing N and P application. The soil test data shows very high salinity and residual N. P levels increase from zones 5–10 due to erosion and reduced crop removal.
Managing Phosphate Based on Field Variability
Soil tests often reveal that phosphorus is lowest in the highest-producing areas of the field. CEC also plays a critical role in determining seed-safe application rates and in-furrow placement decisions.
To manage P at an advanced level, you must:
• Assess field variability
• Identify areas for build or drawdown strategies
Composite soil samples mask these differences. SWAT MAPS captures them, as demonstrated in the following example.
Figure 5. SWAT MAP from a field with production issues in zones 1–2.
{ImageLink}
Table 2. Soil tests reveal the lowest P levels in zone 5–6, the most productive part of the field. In contrast, low pH and CEC in zones 1–2 limited growth, leading to excess P accumulation.
Reporting and Documentation with 4R Nutrient Stewardship
While working with your SWAT agronomist to evaluate soil and nutrient variability, there are additional benefits—one being the 4R Nutrient Stewardship Report.
Figure 6. Snapshot from a SWAT 4R report showing nutrient application ratings for N and P across a farm.
By utilizing SWAT MAPS, we are able to identify the response potential of each zone based on stable soil properties. This allows us to find trends through each individual field independently and create customized fertility plans to take farms 4R nutrient stewardship to the next level.
If you are a SWAT Certified farm, this report is generated automatically. It can be used to document eligibility for sustainability-focused programs like AgriInvest, meeting new 2025 requirements. There are also some grain buyers offering premiums for grain that has been grown in a sustainable way.
If you have question, please reach out to your SWAT Agronomist.
Rachelle Farrell, 4R NMS, CCA
Regional Manager, AB
📞 780-904-9303 | 🌐 swatmaps.com